Reforming our National Spending Priorities
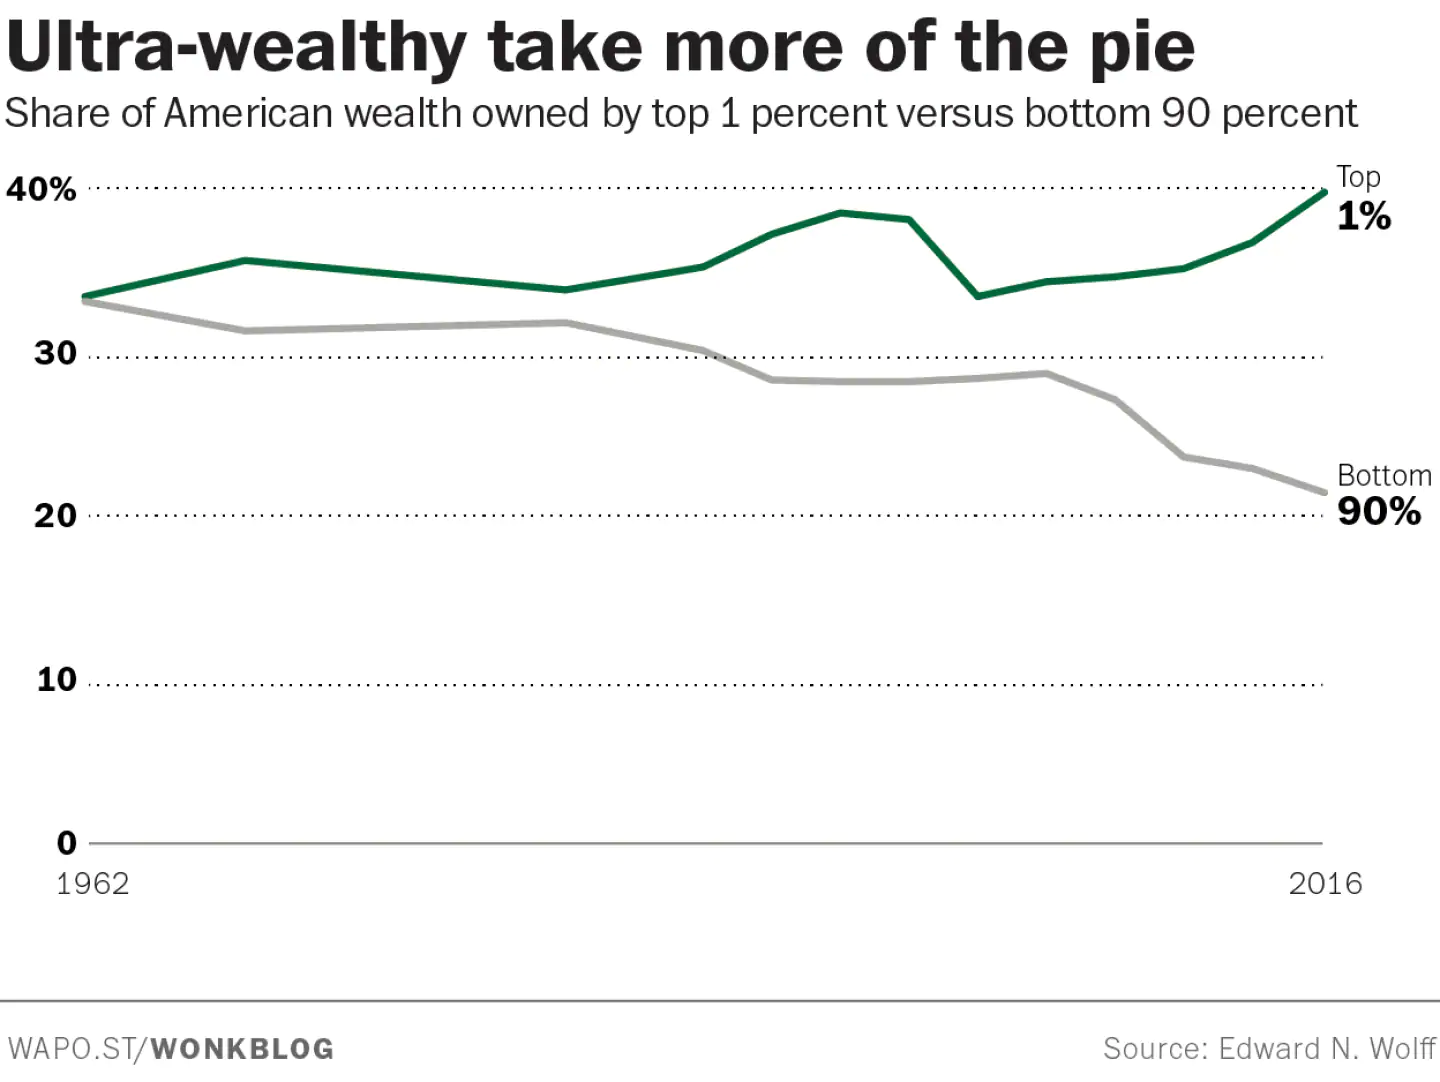
Over the past two decades, wealthy Americans and profitable corporations have disproportionately benefited from federal tax cuts and fiscal policy. Half of American households make less than $65,000 a year,[1] yet since 2000 we have spent over $1.2 trillion on tax cuts to the top 1 percent of earners.[2] The 2017 Republican tax bill (P.L. 115–97) is just one recent example of how our spending priorities have been completely upside-down, prioritizing corporate giveaways and tax cuts for the wealthy while ignoring priorities like investing in children and building the middle class. Driving growth of the debt and deficit through tax cuts for the wealthy undermines our ability to make necessary investments in our schools, measures to address child poverty and food insecurity, tackle maternal mortality, invest in our roads and bridges, provide affordable and quality child care and ensure Americans truly see the gains from their labor.
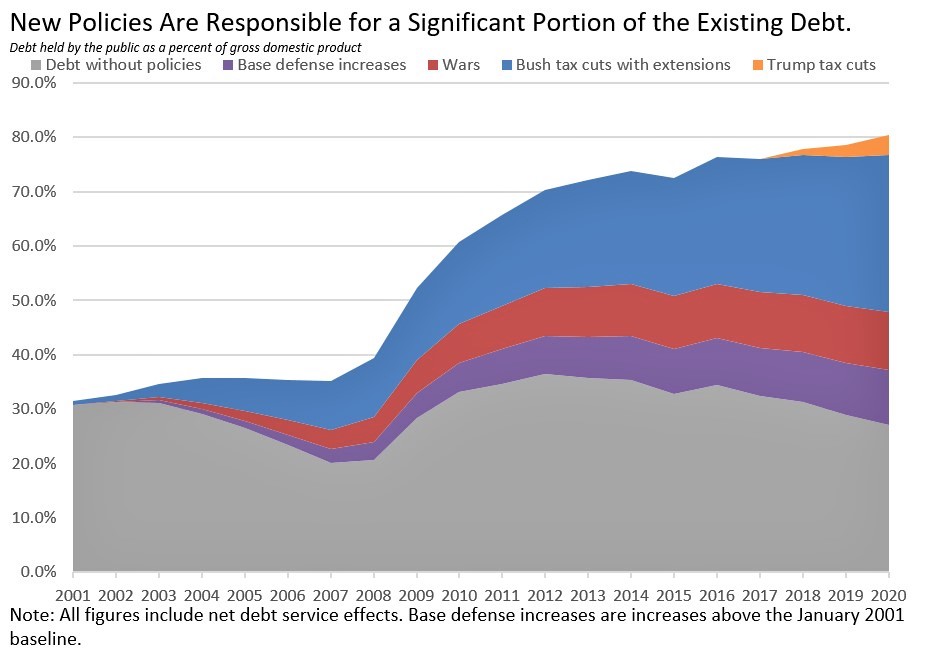
A 2018 report from the Institute for Taxation and Economic Policy found that, since the year 2000, 22 percent of federal tax cuts have gone to the top 1 percent of Americans, and 38 percent of tax cuts have gone to the top 5 percent. The cumulative cost of tax cuts for the top 1 percent is an extra $1.29 trillion added to our debt.[1], [2] That is $3,942 borrowed against every man, woman and child in America in order to provide tax cuts for the top 1 percent.
The 2017 Republican tax bill, P.L. 115–97, further cut taxes for the wealthiest Americans, cutting the top marginal rate by 2.6 percentage points for income earned over $600,000.[3]
In that same 2017 tax bill, corporations saw their tax rates reduced from 35 percent to 21 percent. The Joint Committee on Taxation estimates that each percentage point reduction in the corporate tax rate costs about $100 billion over ten years. (Conversely, each percentage point increase raises $96 billion.[1]) Adding insult to injury, Republicans were able to make the corporate tax cut permanent by increasing costs and taxes on working families by hundreds of billions of dollars[2] through rollbacks to the ACA and changing the way inflation is calculated, resulting in a slower cost-of-living adjustment.
While corporate capital investments failed to materialize[3], [4], [5] following enactment of the 2017 Republican tax bill, share buybacks—which benefit shareholders, who are disproportionately wealthy—surged to unprecedented levels.[6] The Senate had an opportunity to vote on a measure authored by Senator Casey to ensure that firms increase worker wages at the same rate as raises to executives and stock buybacks. The proposal failed on a party-line vote.[7]
There is ample room to reverse these upside-down tax policies and to reinvest funds where the need and impact are greater. With the election of President Biden and the release of the proposed American Jobs Plan and American Families Plan, as well as the enactment of the American Rescue Plan, we are finally beginning a long-overdue process of re-evaluating, and hopefully redirecting, our national priorities and investments. Redirecting federal tax dollars provided in recent years from corporate and wealthy Americans to significant investments in the health, well-being, and opportunity for America’s children will be critical if we are going to “build back better,” as President Biden has said, from the impacts of the pandemic. Such a tax policy would provide an opportunity to invest in our children at a level commensurate with their needs and those of our Nation. President Biden has proposed, through the American Families Plan, a number of significant investments in children that are consistent with the plan outlined in Five Freedoms for American Children, including a dramatic expansion in early childhood education, a permanent, fully-refundable Child and Dependent Care Tax Credit, and a significantly expanded Child Tax Credit. If enacted, these would represent a sea change in our national support for children and their families.
When it comes to our Nation’s children, you cannot put a price on their health and safety. However, there are a number of tax changes that could be enacted to make funds available to carry out the policies proposed here:
- Increase the corporate tax rate to a reasonable level of 28 percent: $740 billion.
- Take measurable steps to reduce the tax gap: $700 billion in additional tax revenue.
- Establish 15 percent corporate minimum tax: ~ $135 billion.
- Return the top tax marginal rate for individuals to its pre-2018 level of 39.6 percent: $90 billion.
- Return the estate tax to its pre-2017 level ($11 million tax exemption): $80 billion.
The policy changes identified are provided not because they match up on a dollar-for-dollar basis with the policies proposed in this document, but to show that there are ample opportunities in the tax code to redirect revenue so that it can be used for commonsense investments in children.
Monitoring and Evaluation
The 2019 report from NASEM on reducing child poverty described the success of 50 years of government policies in reducing child poverty and found that many programs that alleviate poverty—either directly, by providing income transfers, or indirectly, by providing food, housing or medical care—improve child well-being.[1]
The policies proposed in this document will add to and maximize the effects of these programs so that the approximately 12.8 million children still living in poverty can thrive and succeed.[2] Despite confidence in the proven effectiveness of many of our core programs designed to reduce poverty and promote child well-being, it is important to continuously monitor our investments in our children, both to ensure that they are achieving their intended goals, and also to improve and perfect their application and effect over time. Measuring progress will be an essential part of the overall set of activities, and will include outcomes of both well-being/health and cost/return on investment. All of the policies put forth in this proposal should be subjected to rigorous evaluation by their implementing agencies and outside evaluators. Evaluation will include the following processes:
- Evaluation of each policy’s implementation by the responsible agency using typical methodology, including reporting of intermediate results in order to identify barriers.
- Evaluation of the effects of each policy by an external group, including short-term, medium-term, and long-term outcomes.
- Evaluation of the effects of all the policies as an integrated whole by an external group, including short-term, medium-term, and long-term outcomes.
Conclusion
The goal of the Five Freedoms for America’s Children is to reimagine our approach to public policy that affects children by creating a framework to talk about those policies and how they address the needs of children in America. These are commonsense yet forward-leaning policies to ensure that we are giving our children the best start in life. By meeting their needs with respect to health, economic security, nutrition, education and safety, we can set our children on a path to success and our Nation on a path to prosperity.
These proposals are intended to invite a robust debate, with the hope of securing the support of those who want to ensure that the light inside of each and every child can shine brightly as that child grows.
[1] National Academies of Sciences, Engineering, and Medicine, A Roadmap to Reducing Child Poverty (Washington, DC: The National Academies Press, 2019), https://doi.org/10.17226/25246.
[2] Kayla Fontenot, Jessica Semega and Melissa Kollar, Income and Poverty in the United States: 2017 (United States Census Bureau, 2018), https://www.census.gov/content/dam/Census/library/publications/2018/demo/p60-263.pdf.
[1] Options for Reducing the Deficit: 2019 to 2028 (Congressional Budget Office, December 2018), https://www.cbo.gov/publication/54667.
[2] Thomas A. Barthold to Ron Wyden, November 27, 2017, The Wall Street Journal, https://www.wsj.com/public/resources/documents/JCT-Letter-to-Ron-Wydon-112717.pdf.
[3] “$1.5 trillion US tax cut has no major impact on business spending plans: Survey,” January 28, 2019, CNBC, https://www.cnbc.com/2019/01/28/1point5-trillion-us-tax-cut-has-no-major-impact-on-business-spending-plans-survey.html.
[4] Michael Cohn, “TCJA boosted multinationals’ investments overseas more than in U.S.,” July 24, 2019, Accounting Today, https://www.accountingtoday.com/news/tax-cuts-and-jobs-act-boosted-multinationals-investments-overseas-more-than-in-us.
[5] The Editorial Board, “You Know Who the Tax Cuts Helped? Rich People,” August 8, 2018, The New York Times, https://www.nytimes.com/interactive/2018/08/12/opinion/editorials/trump-tax-cuts.html.
[6] Irina Ivanova, “U.S. companies spent record $1 trillion buying back own stock this year,” December 17, 2018, CBS News, https://www.cbsnews.com/news/copmanies-spent-record-1-trillion-buying-back-their-own-stock-this-year/.
[7] Joseph P. Blasi, “Will Tax Reform Raise Worker Wages? Senator Bob Casey’s Idea and the Peter Georgescu Insight,” December 1, 2017, HuffPost, https://www.huffpost.com/entry/will-tax-reform-raise-worker-wages-senator-bob-caseys_b_5a21af0be4b05072e8b56902.
The 2017 Republican tax bill, P.L. 115–97, further cut taxes for the wealthiest Americans, cutting the top marginal rate by 2.6 percentage points for income earned over $600,000.[1]
[1] NOTE: The marginal tax rate is the tax rate applied to income above a specified level. Under current law, the top marginal tax applies to earned income above $600,000 a year for married filers.
Richard C. Auxier, How Federal Income Tax Rates Work (Tax Policy Center, January 19, 2017), https://www.taxpolicycenter.org/publications/how-federal-income-tax-rates-work/full.
A 2018 report from the Institute for Taxation and Economic Policy found that, since the year 2000, 22 percent of federal tax cuts have gone to the top 1 percent of Americans, and 38 percent of tax cuts have gone to the top 5 percent. The cumulative cost of tax cuts for the top 1 percent is an extra $1.29 trillion added to our debt.[1], [2] That is $3,942 borrowed against every man, woman and child in America in order to provide tax cuts for the top 1 percent.
[1] According to analysis by the Institute on Taxation and International Policy (ITEP), “from 2001 through 2018, significant federal tax changes have reduced revenue by $5.1 trillion, with nearly two-thirds of that flowing to the richest fifth of Americans, as illustrated in Figure 1. The cumulative impact on the deficit during this period is $5.9 trillion, including interest payments.”
Steve Wamhoff and Matthew Gardner, Federal Tax Cuts in the Bush, Obama, and Trump Years (Institute on Taxation and International Policy, July 2018), https://itep.org/federal-tax-cuts-in-the-bush-obama-and-trump-years.
[2] David Leonhardt, “$111 Billion in Tax Cuts for the Top 1 Percent,” July 11, 2018, The New York Times, https://www.nytimes.com/2018/07/11/opinion/trump-republicans-tax-cuts-inequality.html.
[1] Gloria G. Guzman, Household Income: 2019 (United States Census Bureau, September 2020), https://www.census.gov/content/dam/Census/library/publications/2020/acs/acsbr20-03.pdf.
[2] Steve Wamhoff and Matthew Gardner, Federal Tax Cuts in the Bush, Obama, and Trump Years (Institute on Taxation and International Policy, July 2018), https://itep.org/federal-tax-cuts-in-the-bush-obama-and-trump-years.